Home
|
News
|
Laws
|
CPRA
|
Shelters
|
Statistics
|
Data
CALIFORNIA
SECTIONS
Home
Statistics
IVHS
Kern
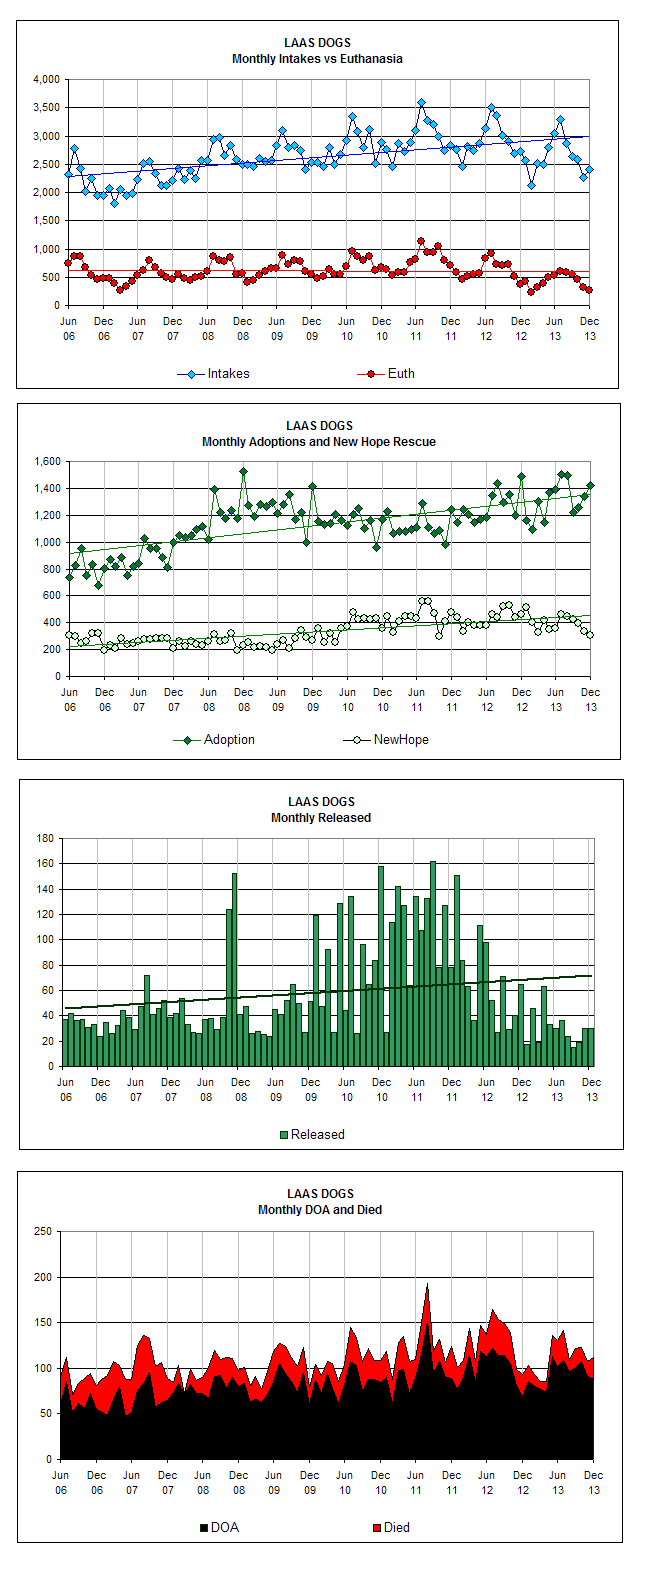
LAAS
LACACC
Merced
Riverside
SLO
Ventura
LAAS
CATS:
Monthly
12 Months Ending
Unweaned
DOGS:
Monthly
12 Months Ending
OTHER INFORMATION:
Rabies Activity Charts
Rabies Reports
About Released
Tracking Sheets
Statistics
LAAS - Los Angeles Animal Services
DOGS MONTHLY